From NOAA:Annual Greenhouse Gas Index (AGGI)
The AGGI is a measure of the direct climate-warming influence of long-lived trace gases in the atmosphere and how that influence has changed since the onset of the industrial revolution. The index was designed to enhance the connection between scientists and society by providing a normalized standard that can be easily understood and followed. The direct warming influence of long-lived greenhouse gases is well understood by scientists and has been reported by NOAA through a range of national and international assessments. Nevertheless, the language of scientists often eludes policy makers, educators, and the general public. This index is designed to help bridge that gap. The AGGI provides a way for this warming influence to be presented as a simple index.
The AGGI is more precisely a measure of the radiative forcings of greenhouse gases in the atmosphere. For simplicity, the 1990 AGGI was set to 1 (2.285 W/m2).
The NOAA Annual Greenhouse Gas Index (AGGI) tracks the increasing amount of heat being added to the atmosphere by human-related greenhouse gas (GHG) emissions. It is based on the highest quality measurements of GHGs in the atmosphere from sites around the world. Its uncertainty is very low.
In a nutshell:
- The AGGI in 2022 was 1.49, which means that we’ve turned up the warming influence from greenhouse gases by 49% since 1990.
- It took ~240 years for the AGGI to go from 0 to 1, i.e., to reach 100%, and 32 years for it to increase by another 49%.
- In terms of CO2 equivalents, the atmosphere in 2022 contained 523 ppm, of which 417 is CO2 alone. The rest comes from other gases.
- CO2 is by far the largest contributor to the AGGI in terms of both amount and rate of increase.
- Note: The IPCC suggests that a constant concentration of CO2 alone at 550 ppm would lead to an average increase in Earth’s temperature of ~3°C (5.4°F).
Here is how radiative forcings are calculated from atmospheric mole fractions, usually expressed as ppm or ppb. From NOAA: Radiative Forcing Calculations

More precisely, the usual carbon dioxide ceiling used within the Intergovernmental Panel on Climate Change (IPCC) is twice the pre-industrial amounts of greenhouse gases expressed as the equivalent amount of CO2 in ppm.
Forcings equivalent to that due to doubling of CO2 over pre-industrial levels total 3.74613 W-m-2, or an index of 1.63945 relative to 1990. The following figure shows the forcings, expressed as components of the AGGI relative to 1990, of CO2, CH4, N2O, and that due to the rest of greenhouse gases, with the climate ceiling shown in red.

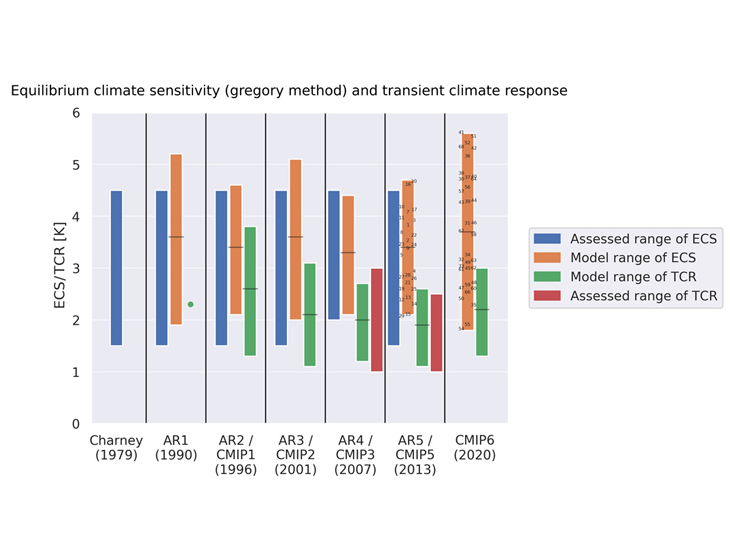
The amount of long-term warming after doubling of CO2 over pre-industrial levels is referred to as
Here is a recent article from Oak Ridge National Laboratory (ORNL) about new research on estimates of ECS. Scientists combine climate models for more accurate projections
Researchers from institutions including the Department of Energy’s Oak Ridge National Laboratory have created a new methstically analyzing climate models that projects future conditions with more fidelity.The method provides a way to adjust for models with high temperature sensitivities — a known problem in the community. By assigning different weights to models and combining them, the researchers estimate that the global temperature will increase between 2 and 5 degrees Celsius by the end of the century.
NOAA's Climate Program Office reports Increasing Certainty Of Climate Sensitivity In Models
The response of Earth’s climate to projected increases in the concentrations of energy-trapping atmospheric greenhouse gases (GHGs) is immediately evident in global temperature increases. Because the amount of future warming, or climate sensitivity, is a critical factor affecting climate projections (e.g. precipitation, extremes, sea level, sea ice, etc.) around the world, scientists need to reduce uncertainty in climate model sensitivity estimates.These model uncertainties largely arise from how clouds, interactions with aerosols, and other processes which may amplify or diminish the impact of increasing GHGs will change in response to warmer conditions and, combined with ocean heat uptake processes and feedbacks, will contribute to climate sensitivity.
The figure is useful.
Now we can see that the underlying question is this: when will total atmospheric radiative forcings reach 3.74613 W-m-2, or an AGGI of 1.63945 relative to 1990.
Note: All calculations were performed within Mathematica Home Edition 13.2.1.0. on a MacBook Pro with macOS Sonoma 14.5. A PDF of the original Mathematica output is available upon request to Jim Diamond, jimd at Linfield dot edu.


No comments:
Post a Comment