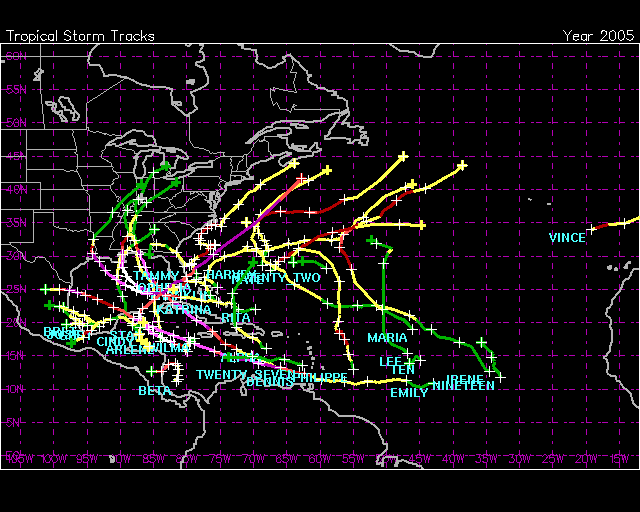
Individual Storm Summary
Winds in knots, pressure in millibars, category is based on Saffir-Simpson scale.
| # | Name | Date | Wind | Pres | Cat | |
| 1 | Tropical Storm ARLENE | 08-13 JUN | 60 | 30 | - | |
| 2 | Tropical Storm BRET | 28-30 JUN | 35 | 1002 | - | |
| 3 | Tropical Storm CINDY | 03-07 JUL | 60 | 992 | - | |
| 4 | Hurricane DENNIS | 05-13 JUL | 130 | 930 | 4 | |
| 5 | Hurricane EMILY | 11-21 JUL | 135 | 929 | 4 | |
| 6 | Tropical Storm FRANKLIN | 21-29 JUL | 60 | 997 | - | |
| 7 | Tropical Storm GERT | 23-25 JUL | 40 | 1005 | - | |
| 8 | Tropical Storm HARVEY | 02-08 AUG | 55 | 994 | - | |
| 9 | Hurricane IRENE | 04-18 AUG | 85 | 975 | 2 | |
| 10 | Tropical Depression TEN | 13-14 AUG | 30 | 1008 | - | |
| 11 | Tropical Storm JOSE | 22-23 AUG | 45 | 1001 | - | |
| 12 | Hurricane KATRINA | 23-31 AUG | 150 | 902 | 5 | |
| 13 | Tropical Storm LEE | 28 AUG-02 SEP | 35 | 1007 | - | |
| 14 | Hurricane MARIA | 01-10 SEP | 100 | 960 | 3 | |
| 15 | Hurricane NATE | 05-10 SEP | 80 | 979 | 1 | |
| 16 | Hurricane OPHELIA | 06-18 SEP | 80 | 976 | 1 | |
| 17 | Hurricane PHILIPPE | 17-24 SEP | 70 | 985 | 1 | |
| 18 | Hurricane RITA | 18-26 SEP | 150 | 897 | 5 | |
| 19 | Tropical Depression NINETE | 30 SEP-02 OCT | 30 | 1006 | - | |
| 20 | Hurricane STAN | 01-05 OCT | 70 | 979 | 1 | |
| 21 | Tropical Storm TAMMY | 05-06 OCT | 45 | 30 | - | |
| 22 | Tropical Depression TWENTY | 08-09 OCT | 30 | 1009 | - | |
| 23 | Hurricane VINCE | 09-11 OCT | 65 | 987 | 1 | |
| 24 | Hurricane WILMA | 15-25 OCT | 150 | 882 | 5 | |
| 25 | Tropical Storm ALPHA | 22-24 OCT | 45 | 998 | - | |
| 26 | Hurricane BETA | 27-31 OCT | 100 | 960 | 3 | |
| 27 | Tropical Depression TWENTY | 14-16 NOV | 30 | 1004 | - | |
| 28 | Tropical Storm GAMMA | 18-19 NOV | 40 | 1006 | - | Active |


No comments:
Post a Comment